ULINK debug and trace adapters
A ULINK debug adapter connects your PC's USB port to your target system (via JTAG or a similar debug interface) and allows you to debug, trace and analyze embedded programs running on the target hardware. All ULINK adapters enable you to:
- Download programs to your target hardware
- Examine memory and registers
- Single-step through programs and insert multiple breakpoints
- Run programs in real-time
- Program Flash Memory
- Connect to a target via JTAG or serial wire modes
- Debug Arm Cortex-M devices on-the-fly
- Examine trace information from Arm Cortex-M3/M4/M7 devices
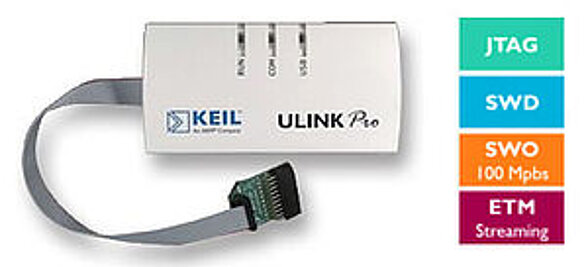
ULINKpro: Debug, serial wire and streaming trace

- Flash Programming + Run-Control
- Memory + Breakpoint (access while running)
- Serial Wire Trace capturing up to 100 Mbit/sec (Manchester mode)
- 50 MHz JTAG clock speed
- ETM Trace Capturing up to 800 Mbit/sec
- Streaming Trace
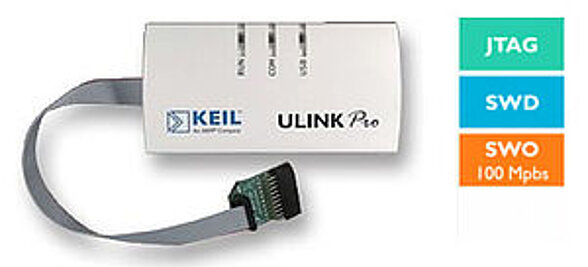
ULINKpro D: Debug and fast serial wire trace

- Flash Programming + Run-Control
- Memory + Breakpoint (access while running)
- Serial Wire Trace capturing up to 100 Mbit/sec (Manchester mode)
- 50 MHz JTAG clock speed
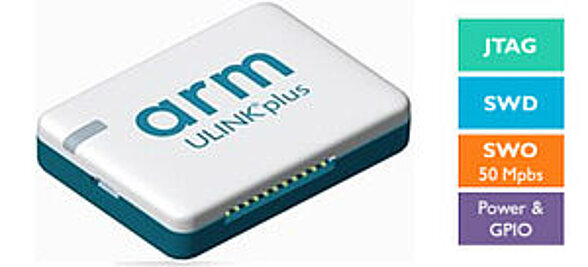
ULINKplus: Debug, serial wire trace, test I/O and power measurement

- Flash Programming + Run-Control
- Memory + Breakpoint (access while running)
- Serial Wire Trace capturing up to 50 Mbit/sec (UART mode)
- 20 MHz JTAG clock speed
- Power measurement for efficient source code
- I/Os for test automation and continuous integration
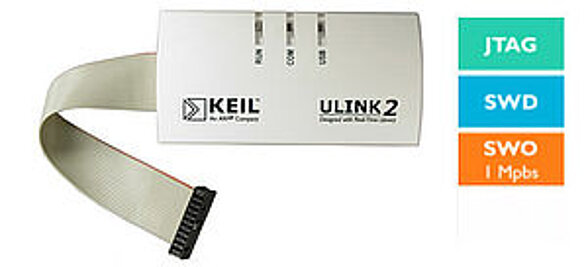
ULINK2: Debug and serial wire trace

- Flash Programming + Run-Control
- Memory + Breakpoint (access while running)
- Serial Wire Trace capturing up to 1 Mbit/sec (UART mode)
- 10 MHz JTAG clock speed