Building a safe and secure embedded world

DSTREAM debug and trace probe

The Arm DSTREAM High-Performance Debug and Trace units enable powerful software debug and optimization on any Arm processor-based hardware target.

With features such as accelerated hardware bring-up for many development platforms and open debug interface for use with third-party tools, DSTREAM debug probes provide a comprehensive solution for the development and debug of complex SoCs when paired with Arm Development Studio.


Accelerated development

FPGA acceleration delivers high download speeds and helps you quickly step through your code on single and multicore devices.

The second-generation probes, DSTREAM-ST, DSTREAM-PT and DSTREAM-HT come with a state of the art target interface design which auto-tunes to the target platform.

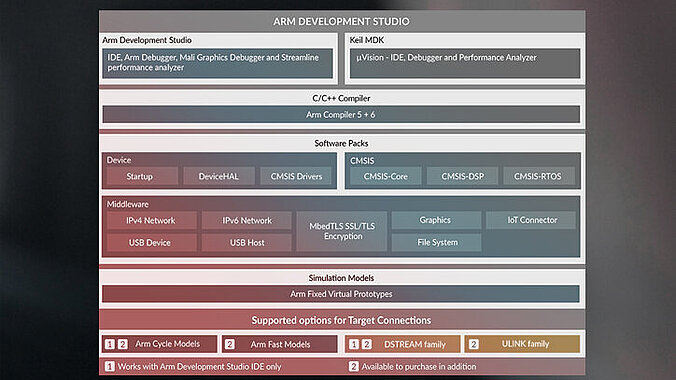
DSTREAM debuggers are fully integrated into the Arm Development Studio which includes powerful software utilities to assist with SoC bring-up and hardware validation. It also provides interfaces for third-party and custom tools. From initial development to device bring-up, make Development Studio and DSTREAM-PT your debug solution.

Armv8 support

DSTREAM debug probes are designed with the latest Arm processors and technologies in mind, which are being implemented in ever more complex configurations. Save significant development time with the latest Armv8 SoCs.

Development Studio comes with a platform configuration utility (PCE) that can use DSTREAM-ST and DSTREAM-PT to interrogate your target device to autodetect both core and CoreSight configuration elements. PCE can then auto create the Development Studio platform configuration, providing you several debug and trace configurations, saving you time during platform bring up.

To complement this, we also provide a high-level abstraction layer (the debug and trace services layer - DTSL), which makes adding customized trace objects and catering for complex topologies significantly easier.

Used and trusted by our partners around the world for Armv8 development, DSTREAM debug probes and Development Studio, backed up with Arm expert support have been instrumental to complex Cortex-A based SoC bring up.

High-bandwidth trace

Trace is an essential tool for the resolution of complex software/hardware and timing-related issues, as it enables post-analysis of a software execution without the need for any software or hardware instrumentation.

The DSTREAM-PT (up to 8GB) and DSTREAM-HT (up to 16GB) trace buffer enables high-bandwidth parallel trace for long periods, providing further visibility of how the software executes on the target.
Debug probe software

Arm Development Studio together with the DSTREAM debug probes includes powerful software utilities for SoC bring-up and interfaces for third-party IP support.

 
CoreSight Access Tool (CSAT)

The CoreSight Access Tool (CSAT) provides a scriptable low-level interface to a target’s CoreSight Debug Access Port (DAP), which gives access to on-chip debug and system buses. CSAT is useful to perform initial bring-up tests before a debugger connection to the target is available.

CSAT enables the configuration of third-party IP connected to the DAP, for example custom instrumentation hardware, and can be used while a debugger is connected to an Arm processor. This enables the debug of complex hardware-related problems.

Python scripting

Arm target connection products implement powerful low-level target control via Python scripts. For example, this allows you to configure them to automatically refresh the watchdog timer while they are connected to the target, and work around hardware bugs.

Development Studio also uses Jython scripting for debug and trace configuration, making it simple to define complex trace topologies and helping you to route trace to Development Studio

RDDI API compatibility

RDDI is the main set of C APIs between Arm debuggers and DSTREAM devices. RDDI contains several API sets and these are supported by each device as follows:

RDDI API ClassDTREAM SupportDSTREAM-ST-SupportDSTREAM-PT-Support
RDDI-Config
RDDI-Browse
RDDI-JTAG
RDDI-DAPxxx
RDDI-Debug
RDDI-Tracexx
RDDI-StreamingTracex

Third-party debuggers or other customer-specific tooling for both Arm and other processor cores can connect to DSTREAM probes using the RDDI interface. Whilst RDDI is a C level API, other languages can be used, such as Java and Python. The firmware in DSTREAM family has a flexible architecture to connect to multiple Arm and third-party IP cores on an SoC via a single debug interface.

RDDI is freely available from within the Development Studio installation.

A low-level RDDI connection to DSTREAM units can be used to gain access to the JTAG scan-chains inside the target device. This enables the unit to be used for simple tasks such as production testing and flash programming.

Compare DSTREAM units

Search FormContactOnlineshop